Evidation Update (Julio’s team)
Contents
Evidation Update (Julio’s team)
Background and Introduction
We will be referencing the following study throughout our project: An Alternative to the Light Touch Digital Health Remote Study: The Stress and Recovery in Frontline COVID-19 Health Care Workers Study
Project Goals
Our team is working with Evidation Health to study how shifts in mood, energy, cough, and stress among frontline COVID-19 workers can be measured using data from Garmin watch and Oura ring. These factors were also self-reported everyday through surveys using a 5 point scale. As of now, we are splitting our teams into groups of 2 and 3 to explore and familiarize ourselves with Garmin and Oura sample datasets. The main data will be collected from frontline COVID-19 workers and will be provided by Evidation Health.
This project’s long-term goal is to utilize wearable device data coupled with survey data to fit a model that would predict stress. Ultimately, we hope that these analyses can lead to a way to detect stress and deliver interventions when one is in a stressful situation.
Progress:
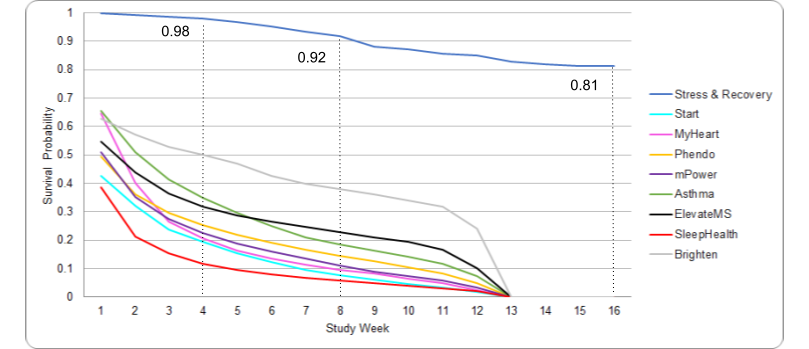
Before we tackle this overall goal, there are various steps we are taking along the way. For instance, our group studied the article cited above in order to gain background information on the data collection and experimental process. The article focused on gauging participant retainment in the study, which is visualized in the article (Figure 1). This plot reveals that the data collection methods (i.e. wearable devices, surveys) used in this study (“Stress and Recovery”) were significantly more effective in maintaining a high participant retention, especially compared to previous studies around similar topics.
|
|---|
Fig.1 - Participant Retention with Light Touch Techniques |
Furthermore, we do not have access to the data that the project will be based upon. Fortunately, we are able to prepare for the transition to our project dataset by working with sample data; currently, we are exploring Garmin and Oura datasets found on Kaggle to get familiarized with the type of data we will be working with later on. This includes:
Creating and re-creating visualizations (primarily from the Kaggle notebooks correlated with the datasets)
Learning how to work with time series data
Analyzing and taking note of any relationships among variables
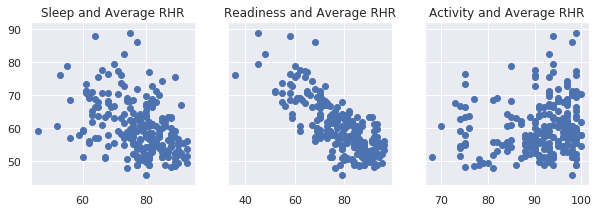
One example of a visualization we could try to recreate from the Kaggle notebook for the Oura Ring dataset is pictured in Figure 2.
|
|---|
Fig.2 - Scatterplots comparing Average Resting Heart Rate with Sleep, Readiness, and Activity from Oura Kaggle |
Data
The data was previously collected for a study conducted in 2021. During the period when the data was collected, data was collected from healthcare workers wearing the Oura 2 smartring off-shift; for a period of 4 weeks, participants wore a Garmin smartwatch on-shift. Participants also completed study surveys and active tasks through a REDCAP study app to supplement the device data. The dataset in total will contain 6 different data types: data streams from the Oura Ring 2 and Garmin Smartwatch, Rescue Time (Participant Use of Smartphone), Active Tasks, REDCap Research Staff Entered Data and REDCap Study App Surveys.
The data that will be used for this project is located in Synapse. As of February 4th, 2022, we are still working towards gaining access for this data from Synapse, which includes multiple steps of registration in order to ensure the security of the participants in the data.
Ethical Concerns
As part of the process to access the data, all members of the group had to register and qualify through Synapse. The data also has multiple conditions of use, including but not limited to: no attempts at re-identifying participants, agreeing to keep the data confidential and secure, and data cannot be used for commercial advertisement.
Fundamentally the main purpose of our work is to improve the health and wellbeing of others. However, because of the data’s demographics, our research might be overly focused on a small subset of the general population. The demographic of our data is overwhelmingly Caucasian, over 90% of respondents. On top of that, the data focuses on health care professionals, which we can assume are more health-conscious than the general population. Wearable devices also have a higher cost of entry, upward of 500$. Although we are confident that our work will still provide valuable insight, these ethical limitations are worth noting.
Technology
Python
Packages: NumPy, pandas, matplotlib, seaborn