Survey Pre-Processing
Contents
Survey Pre-Processing
Project Update 1
Project Details
Founded in 2016, the Energy and Environment Transitions (ENVENT) Lab at the University of California, Santa Barbara (UCSB) is a hub for climate policy advocacy, climate communication, and environmental politics research. The lab is co-directed by Prof. Leah Stokes and Prof. Matto Mildenberger.
Our capstone project is in relation to a recent endeavor of theirs; the ENVENT lab has collected over three million public opinion survey responses from around the world, all of which contains cross-national data from 2000 to the present where a climate-related question was asked in two or more countries. It is part of their greater effort towards modeling climate concern in more than 2500 subnational regions around the world, utilizing a Bayesian statistical model.
Specifically, we will joining Prof. Mildenberger and we will be cleaning and organizing covariate data from more than 100 surveys, then merging this demographic information into existing data processing routines the ENVENT lab utilizes. The goal is to develop predictive models to understand how demographic attributes (gender, income, race, age, education level, etc.) are differentially predictive of climate opinion in different countries, continents, time periods.
This project relates to the broader activities of the lab as it contributes to one of the core goals of the lab, climate communication research. Other research conducted by the lab includes polarity in regards to climate change, environmental and energy public opinion and political behavior, and democracy and political behavior.
Summary of the Datasets
We are working with a broad range of datasets spanning regions across the world, some dating back from 1998 and others all the way to the present day. Our concentration is on demographic variables related to Gender, Age, Religion, Education, Race/Ethnicity, Income, and Number of children per household. We are gathering demographic information from 100+ surveys that have been collected by the ENVENT team. Surveys that were chosen each ask at least one climate related question in two or more countries and come from well-known reputable organizations.
Progress
So far, our main accomplishment with our project has been understanding the different data that is available to us. Since we are looking at so many different surveys, it took a while to parse through each one and understand the variables. For each survey, we have had to look at a corresponding public code book that contains the question number, question asked, answer choices, corresponding variable name, etc. Once we looked through the surveys/code books, we picked demographic variables that were present across most of the 140 surveys. We ended up choosing religion, gender, income, race, age, education level, and number of children. A challenge we have run into along the way is finding a way to standardize our demographic variables. For example, we have been discussing a way that we could standardize income when dealing with data from different countries with different currencies and different standards for income levels. Some potential ideas we have come up with have been using GDP, the gini index, or a classification of above/below the median income level for that country. We are currently working towards making a spreadsheet that serves as a key of all questions being asked that correspond to our chosen demographic variable.
Example Survey Question from C
Question Number: Q93
Question: Do you have an electric connection to your home from the mains? [If yes] How often is the electricity actually available from this connection?
Variable Label: Q93. Electric connection from mains
Values: 0-5, 9, 8, -1
Value Labels: 0=No mains electric supply or connection to the home, 1=Never, 2=Occasionally, 3=About half of the time, 4=Most of the time, 5=All of the time, 9=Don’t know, 8=Refused to answer, -1=Missing
Source: Afrobarometer Round 5
Note: Interviewer was instructed to not ask this question if it was 100% clear that there was no electricity supply to the home, e.g., in an unserved rural area.
Next Steps
The beginning of this project is a large effort of data cleaning, organizing and processing which we are just now getting into the flow of. As outlined above, our eventual goal is to develop predictive models to understand how the demographic attributes of gender, income, race, age, education level, religion, and number of children are differentially predictive of climate opinion in different countries, continents, time periods. Below is an image of a similar display of the descriptive values that we may obtain when comparing a demographic variable to a measure of climate opinion. In the example below, the researchers show the responses in the United States for a few questions related to belief in climate change along the demographic lines of party preference. Ultimately we will be able to compare answers to similar climate opinion variables with our demographic data to both produce similar displays as well as create predictive models.
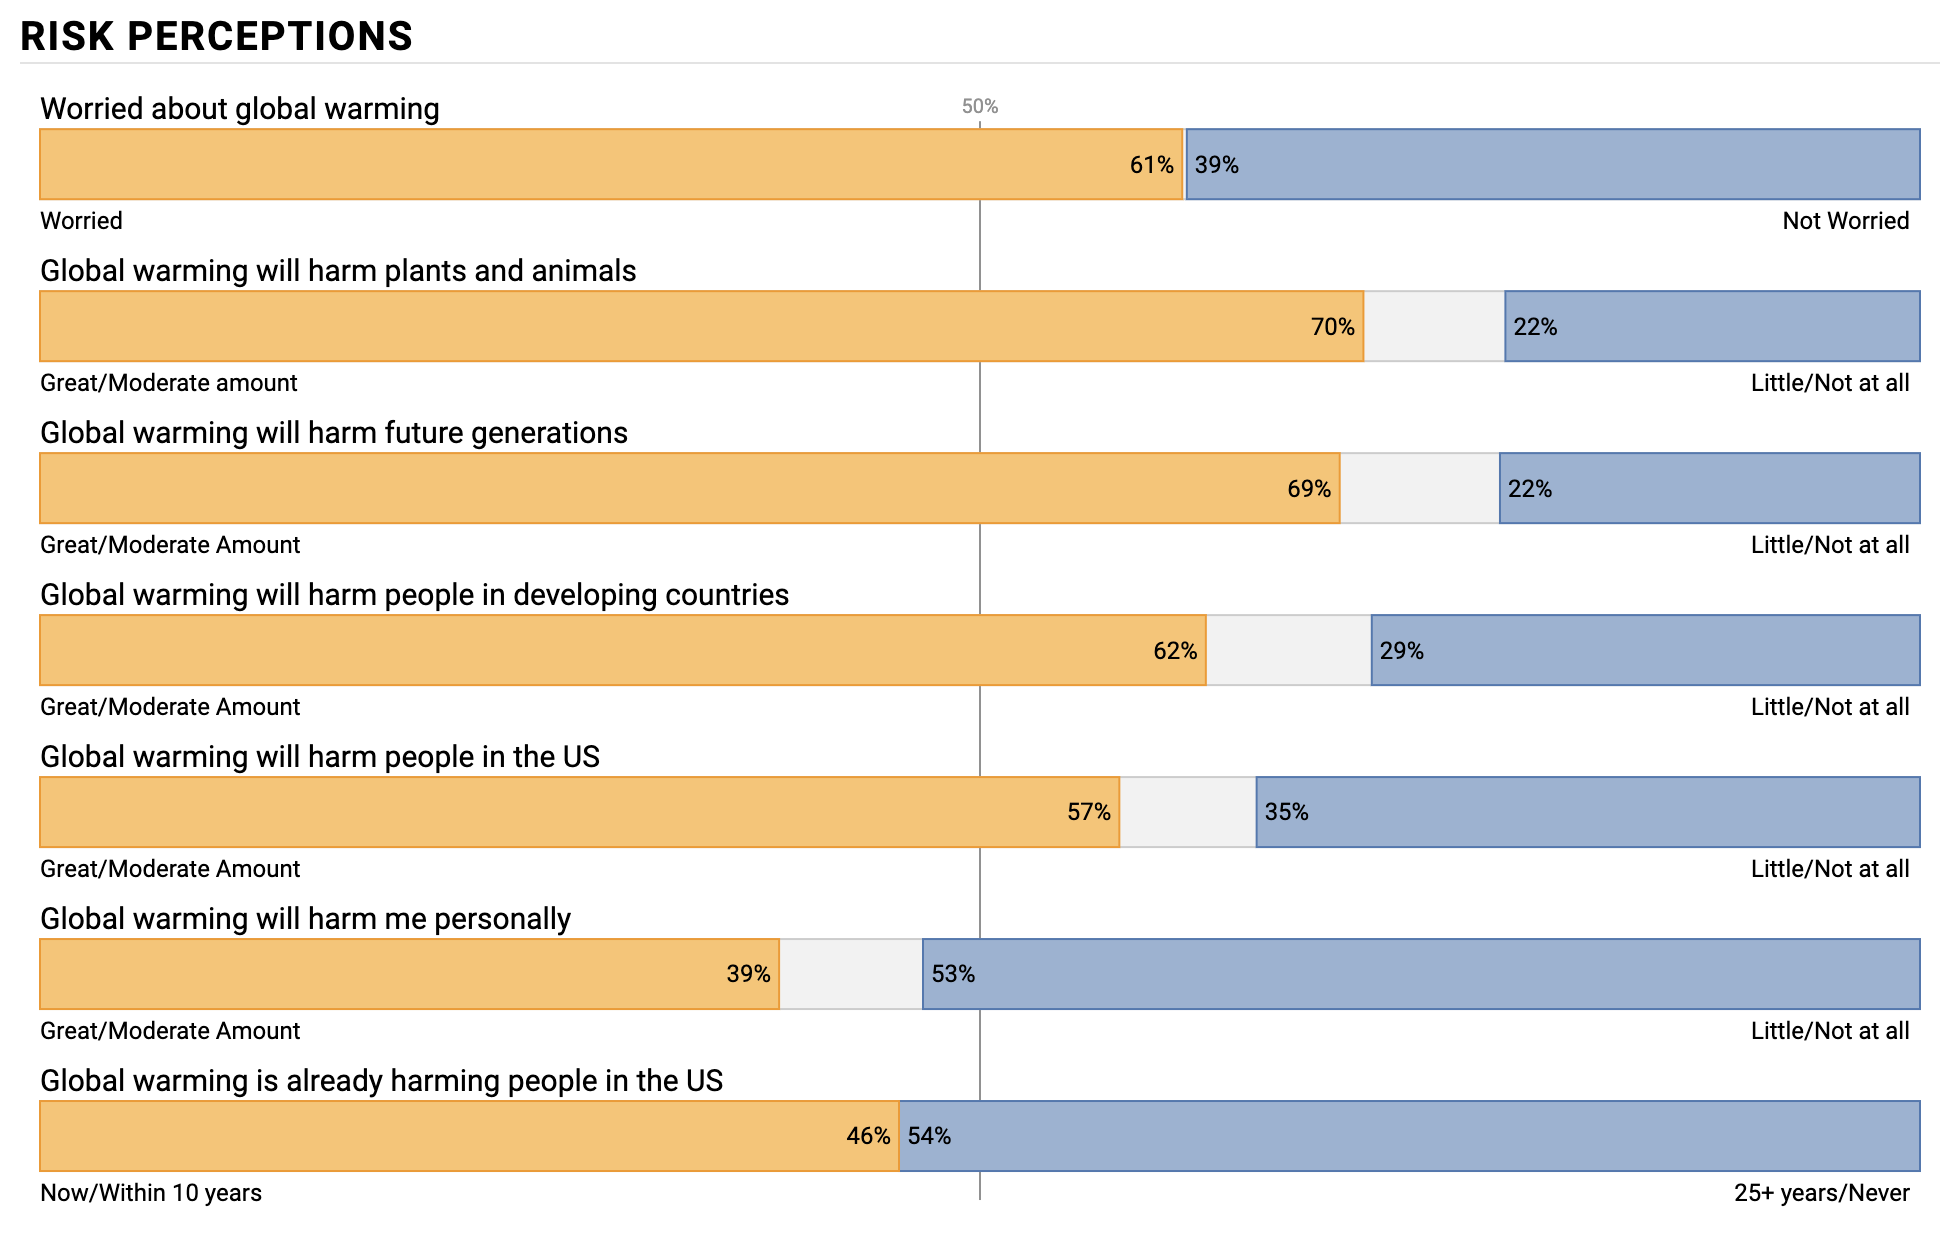 (image taken from: https://www.finereport.com/en/wp-content/uploads/2019/10/tableau2.png)